Sunspots — what they are, why they matter, and what to do about it
Sunspots are dark regions on the solar photosphere where the magnetic field is unusually strong. They’re not just "interesting astronomy": sunspots mark active regions that can produce solar flares and coronal mass ejections (CMEs), which are the events most likely to disrupt HF propagation.
Right now (ham-relevant quick context)
What does this mean to me?
What does this mean to me?
What does this mean to me?
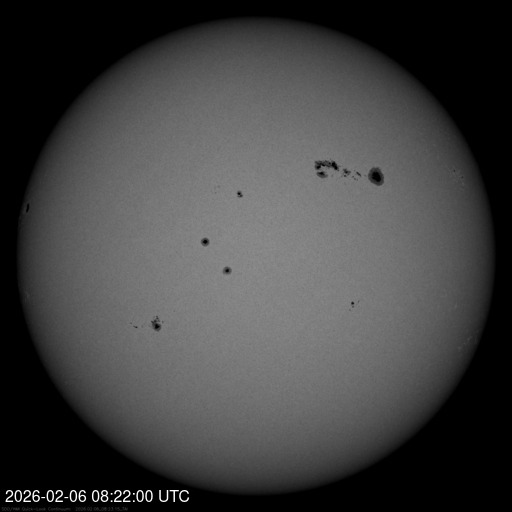
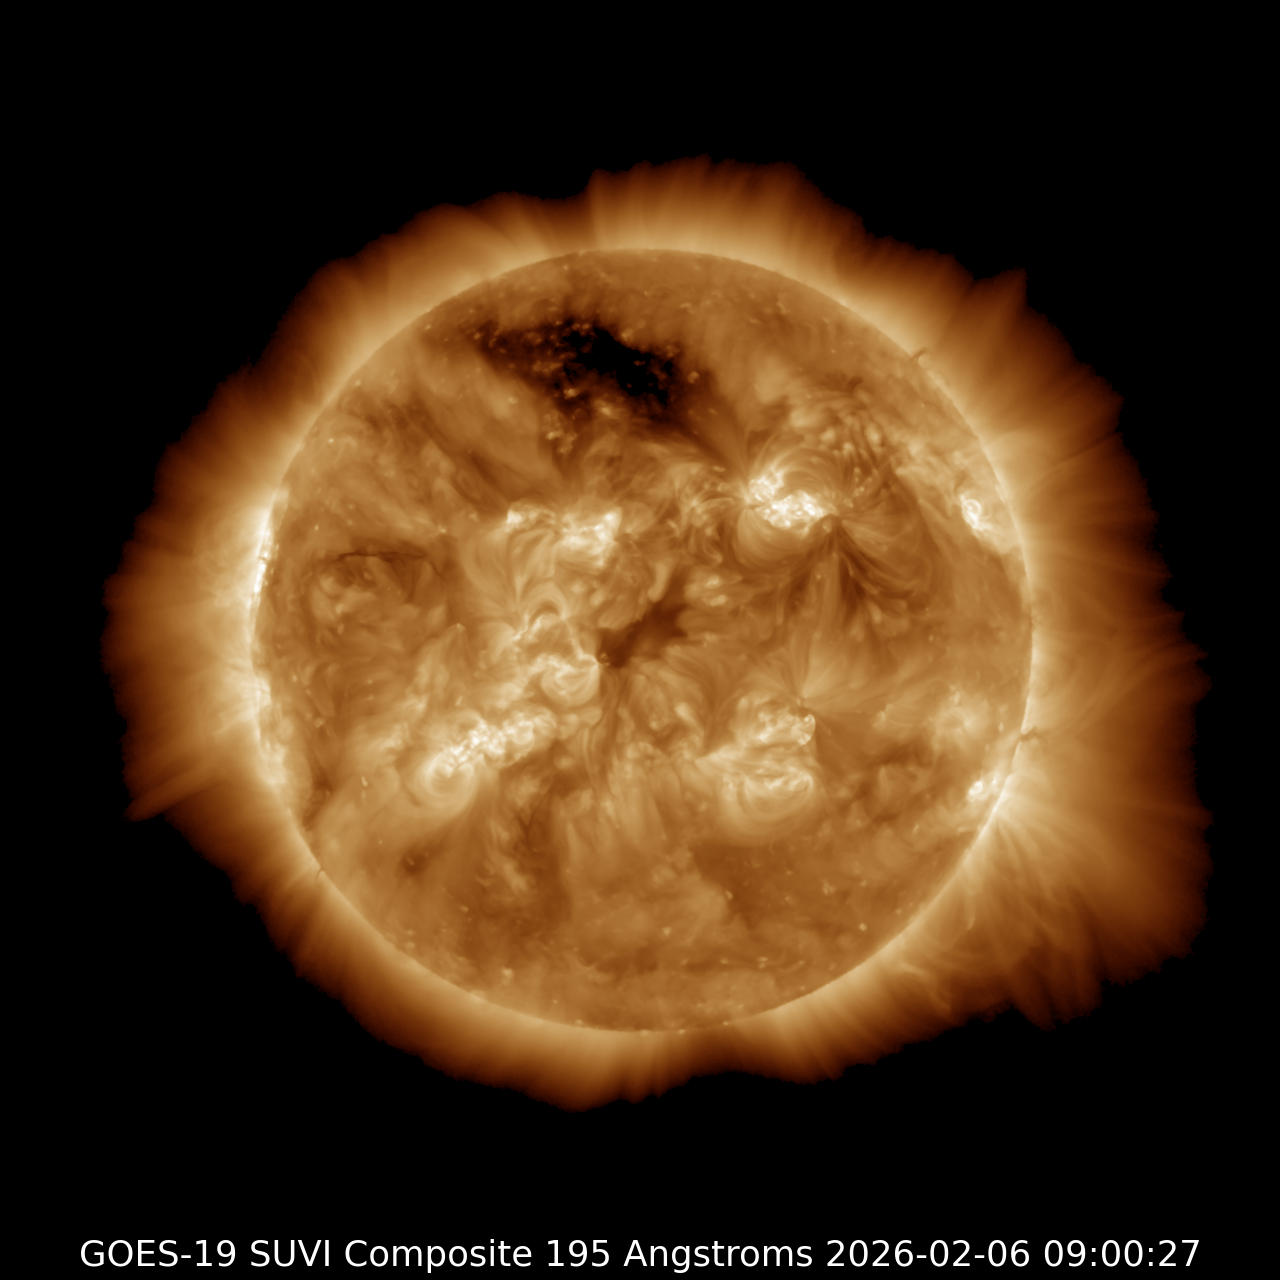
Visual: the Sun right now
These are SWPC-provided "latest" imagery tiles. Click any image to enlarge.
What are sunspots, physically?
A sunspot is a region where magnetic field lines concentrate and inhibit normal convective heat transport. Less heat reaches the surface locally, so the spot looks darker (cooler) compared to surrounding photosphere. Typical spot fields are on the order of thousands of gauss, far stronger than Earth's surface field.
What does this mean to me?
How sunspots form (the short, honest version)
- Solar dynamo: the Sun’s rotating, convecting plasma generates magnetic fields.
- Flux emergence: buoyant magnetic flux tubes rise and pierce the photosphere as bipolar regions (pairs/groups of spots).
- Complexity matters: twisted/sheared fields store free magnetic energy; that energy can be released as flares/CMEs.
A useful operator translation: more/larger/complex spot groups generally imply a higher probability of flare activity.
How sunspots are measured (and what those numbers mean)
- Sunspot Number (SSN): a standardized count-like index used to track solar-cycle activity.
- F10.7 flux: a radio measurement that tracks solar EUV fairly well; often correlates with SSN.
- Active-region classification: systems like Mount Wilson and McIntosh describe magnetic/structural complexity (a flare risk clue).
What does this mean to me?
Active-region classification (McIntosh + Mount Wilson) — a practical operator view
Two widely used descriptors appear in daily region summaries: the Mount Wilson magnetic class (how the polarities are arranged) and the McIntosh class (a compact code describing group structure). You don’t need to memorize every nuance — you just need to recognize when a region is “simple” vs “complex and flare-capable.”
| System | Common Values | Operator Translation | Why You Care |
|---|---|---|---|
| Mount Wilson | Alpha, Beta, Beta-Gamma, Beta-Gamma-Delta | Alpha/Beta = simpler. Beta-Gamma/Delta = more complex, mixed polarities. | More complex magnetic structure generally implies higher probability of M/X flares (R events). |
| McIntosh | 3-character codes (e.g., “Eki”, “Fkc”) | Bigger/more developed groups + compact structure can be more flare-capable. | It’s a quick “shape + complexity” label that helps identify which region(s) to watch. |
What does this mean to me?
The Solar Region Summary table below shows these codes for today’s active regions.
Solar Region Summary (current active regions)
This is the daily SWPC region list: NOAA active-region number, heliographic location, area/extent, and the two “complexity shorthand” codes. If this table is blank, it usually means the server cannot reach SWPC right now (see the Status page).
Issued: 2026 Feb 06 0030 UTC Obs date: 2026 Feb 05
| Region | Location | Area | Extent | McIntosh | Spots | Mag |
|---|---|---|---|---|---|---|
| 4358 | N17W57 | 30 | 5 | BXO | 3 | B |
| 4362 | S17W22 | 40 | 4 | CAO | 8 | B |
| 4366 | N14W19 | 1100 | 18 | FKC | 25 | BGD |
| 4367 | N09E12 | 50 | 8 | CAO | 5 | B |
| 4368 | S10E12 | 40 | 2 | HSX | 1 | A |
| 4369 | S03E17 | 40 | 2 | HSX | 1 | A |
| 4370 | S19E25 | 10 | 1 | AXX | 2 | A |
| 4371 | S23E34 | 120 | 8 | DKI | 14 | BD |
How do I interpret these codes?
Solar Cycle (predicted smoothed SSN range)
This is a long-term trend indicator (months/years). For day-to-day operations, disturbances dominate.
More detail is in Solar Cycle.
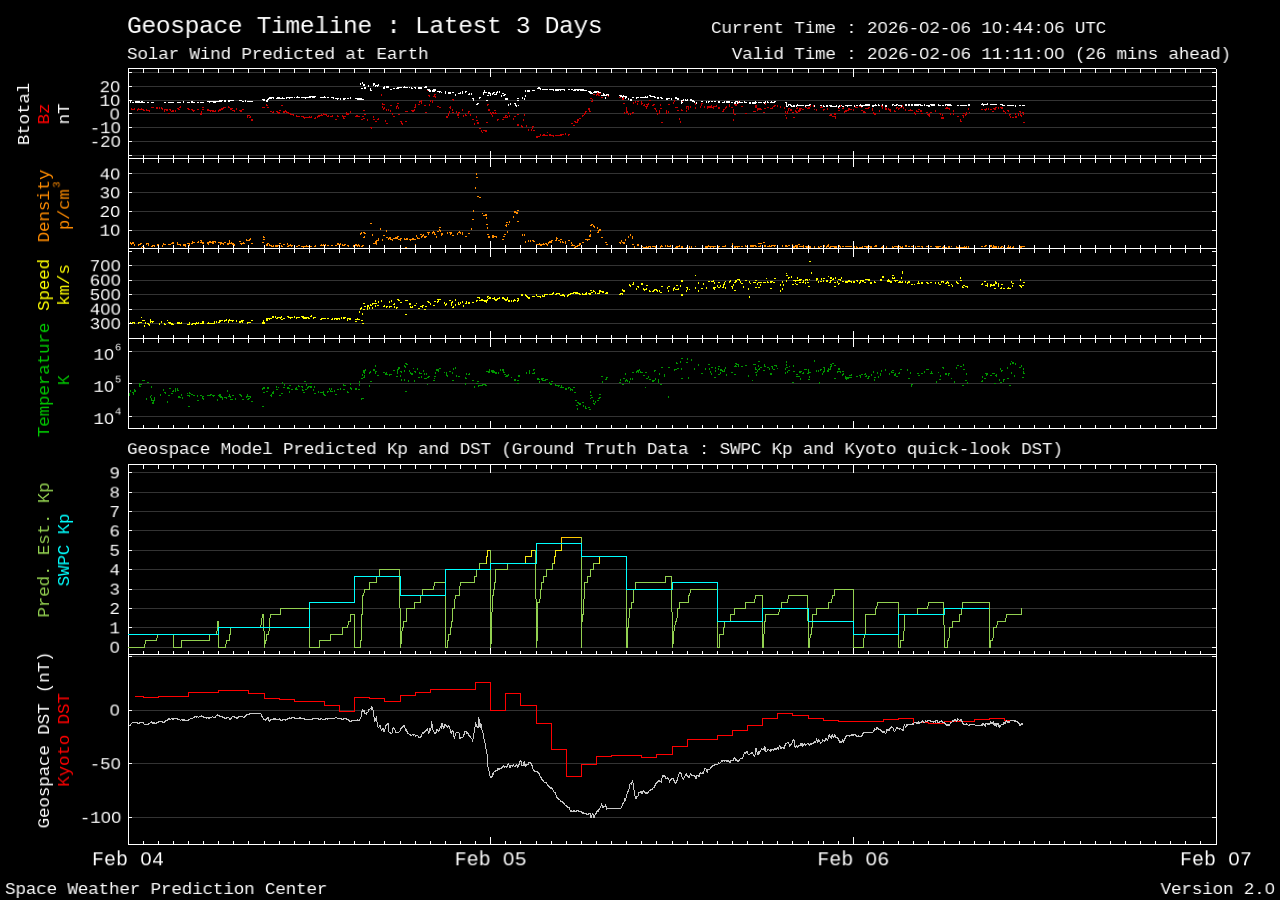
Solar wind: what it is
The solar wind is a continuous outflow of charged particles (mostly protons/electrons) carrying the Sun’s magnetic field (the IMF). When fast streams or CME-driven plasma reach Earth, they can drive geomagnetic storms.
- Bz south (negative): magnetic reconnection becomes efficient → storm potential rises.
- Speed/density up: more energy coupled into Earth’s system.
- Outcome: aurora expansion, polar absorption, HF instability, and sometimes VHF aurora.
Live context: solar wind & geomagnetic response
On-air impacts: the chain from sunspots → flares/CMEs → ionosphere
- Flares (minutes to hours): increase X‑ray/EUV, boosting D‑region ionization on the dayside → more absorption → sudden HF fadeouts (R events).
- CMEs (1–4 days): disturb Earth’s magnetosphere → geomagnetic storms (G events) → polar HF degradation, fading/flutter, and aurora.
- High baseline activity: often raises MUF (good), but increases the probability of disruptive events (bad).
How to protect your station and electronics
Most station damage risk comes from lightning and power transients. Severe geomagnetic storms can also drive long-conductor currents (grid/pipelines), but at the amateur-station scale your best ROI is disciplined grounding, bonding, and surge control.
- Single-point ground/bonding: bond radio, power supply, coax protectors, and ground bar together to avoid dangerous potential differences.
- Coax surge protection: use quality lightning arrestors and bond them properly; route coax to an entry panel.
- AC surge protection: use whole-house or shack-level surge protection and keep safety grounding intact.
- Unplug when needed: for thunderstorms or severe alerts, physically disconnect antennas and power (no protector is perfect).
- Antenna considerations: avoid long, unbonded control lines; bond towers/masts; keep ground leads short and wide.
What does this mean to me?
SWPC forecast text (for context)
Source: NOAA/SWPC. Interpretation on this site is educational; always cross-check with SWPC directly.
Alerts (recent/active)
- 2026-02-05 15:51:31.013 — Space Weather Message Code: WATA20 Serial Number: 1094 Issue Time: 2026 Feb 05 1551 UTC WATCH: Geomagnetic Storm Category G1 Predicted Highest Storm Level Predicted by Day: Feb 06: G1 (Minor) Feb 07: None (Below G1) Feb 08: G1 (Minor) THIS SUPERSEDES ANY/ALL PRIOR WATCHES IN EFFECT NOAA Space Weather Scale descriptions can be found at www.swpc.noaa.gov/noaa-scales-explanation Potential Impacts: Area of impact primarily poleward of 60 degrees Geomagnetic Latitude. Induced Currents - Weak power grid fluctuations can occur. Spacecraft - Minor impact on satellite operations possible. Aurora - Aurora may be visible at high latitudes, i.e., northern tier of the U.S. such as northern Michigan and Maine.
- 2026-02-05 08:54:59.493 — Space Weather Message Code: WARK04 Serial Number: 5246 Issue Time: 2026 Feb 05 0854 UTC EXTENDED WARNING: Geomagnetic K-index of 4 expected Extension to Serial Number: 5245 Valid From: 2026 Feb 04 1515 UTC Now Valid Until: 2026 Feb 05 1800 UTC Warning Condition: Persistence NOAA Space Weather Scale descriptions can be found at www.swpc.noaa.gov/noaa-scales-explanation Potential Impacts: Area of impact primarily poleward of 65 degrees Geomagnetic Latitude. Induced Currents - Weak power grid fluctuations can occur. Aurora - Aurora may be visible at high latitudes such as Canada and Alaska.
- 2026-02-05 08:54:38.777 — Space Weather Message Code: WARK05 Serial Number: 2187 Issue Time: 2026 Feb 05 0854 UTC EXTENDED WARNING: Geomagnetic K-index of 5 expected Extension to Serial Number: 2186 Valid From: 2026 Feb 05 0300 UTC Now Valid Until: 2026 Feb 05 1500 UTC Warning Condition: Persistence NOAA Space Weather Scale descriptions can be found at www.swpc.noaa.gov/noaa-scales-explanation Potential Impacts: Area of impact primarily poleward of 60 degrees Geomagnetic Latitude. Induced Currents - Weak power grid fluctuations can occur. Spacecraft - Minor impact on satellite operations possible. Aurora - Aurora may be visible at high latitudes, i.e., northern tier of the U.S. such as northern Michigan and Maine.
- 2026-02-05 04:33:48.110 — Space Weather Message Code: ALTK05 Serial Number: 1963 Issue Time: 2026 Feb 05 0433 UTC ALERT: Geomagnetic K-index of 5 Threshold Reached: 2026 Feb 05 0426 UTC Synoptic Period: 0300-0600 UTC Active Warning: Yes NOAA Scale: G1 - Minor NOAA Space Weather Scale descriptions can be found at www.swpc.noaa.gov/noaa-scales-explanation Potential Impacts: Area of impact primarily poleward of 60 degrees Geomagnetic Latitude. Induced Currents - Weak power grid fluctuations can occur. Spacecraft - Minor impact on satellite operations possible. Aurora - Aurora may be visible at high latitudes, i.e., northern tier of the U.S. such as northern Michigan and Maine.
- 2026-02-05 02:59:21.917 — Space Weather Message Code: WARK05 Serial Number: 2186 Issue Time: 2026 Feb 05 0259 UTC WARNING: Geomagnetic K-index of 5 expected Valid From: 2026 Feb 05 0300 UTC Valid To: 2026 Feb 05 0900 UTC Warning Condition: Onset NOAA Scale: G1 - Minor NOAA Space Weather Scale descriptions can be found at www.swpc.noaa.gov/noaa-scales-explanation Potential Impacts: Area of impact primarily poleward of 60 degrees Geomagnetic Latitude. Induced Currents - Weak power grid fluctuations can occur. Spacecraft - Minor impact on satellite operations possible. Aurora - Aurora may be visible at high latitudes, i.e., northern tier of the U.S. such as northern Michigan and Maine.
- 2026-02-04 23:12:38.203 — Space Weather Message Code: WARK04 Serial Number: 5245 Issue Time: 2026 Feb 04 2312 UTC EXTENDED WARNING: Geomagnetic K-index of 4 expected Extension to Serial Number: 5244 Valid From: 2026 Feb 04 1515 UTC Now Valid Until: 2026 Feb 05 1200 UTC Warning Condition: Persistence NOAA Space Weather Scale descriptions can be found at www.swpc.noaa.gov/noaa-scales-explanation Potential Impacts: Area of impact primarily poleward of 65 degrees Geomagnetic Latitude. Induced Currents - Weak power grid fluctuations can occur. Aurora - Aurora may be visible at high latitudes such as Canada and Alaska.
- 2026-02-04 17:00:58.543 — Space Weather Message Code: ALTK04 Serial Number: 2627 Issue Time: 2026 Feb 04 1700 UTC ALERT: Geomagnetic K-index of 4 Threshold Reached: 2026 Feb 03 1700 UTC Synoptic Period: 1500-1800 UTC Active Warning: Yes NOAA Space Weather Scale descriptions can be found at www.swpc.noaa.gov/noaa-scales-explanation Potential Impacts: Area of impact primarily poleward of 65 degrees Geomagnetic Latitude. Induced Currents - Weak power grid fluctuations can occur. Aurora - Aurora may be visible at high latitudes such as Canada and Alaska.
- 2026-02-04 15:35:28.013 — Space Weather Message Code: SUMSUD Serial Number: 295 Issue Time: 2026 Feb 04 1535 UTC SUMMARY: Geomagnetic Sudden Impulse Observed: 2026 Feb 04 1506 UTC Deviation: 16 nT Station: BOU NOAA Space Weather Scale descriptions can be found at www.swpc.noaa.gov/noaa-scales-explanation
- 2026-02-04 15:08:25.473 — Space Weather Message Code: WARK04 Serial Number: 5244 Issue Time: 2026 Feb 04 1508 UTC WARNING: Geomagnetic K-index of 4 expected Valid From: 2026 Feb 04 1515 UTC Valid To: 2026 Feb 04 2359 UTC Warning Condition: Onset NOAA Space Weather Scale descriptions can be found at www.swpc.noaa.gov/noaa-scales-explanation Potential Impacts: Area of impact primarily poleward of 65 degrees Geomagnetic Latitude. Induced Currents - Weak power grid fluctuations can occur. Aurora - Aurora may be visible at high latitudes such as Canada and Alaska.
- 2026-02-04 14:33:09.777 — Space Weather Message Code: WARSUD Serial Number: 250 Issue Time: 2026 Feb 04 1433 UTC WARNING: Geomagnetic Sudden Impulse expected Valid From: 2026 Feb 04 1505 UTC Valid To: 2026 Feb 04 1535 UTC IP Shock Passage Observed: 2026 Feb 04 1421 UTC NOAA Space Weather Scale descriptions can be found at www.swpc.noaa.gov/noaa-scales-explanation
Sources (recommended reading)
- NOAA SWPC Products & Data: swpc.noaa.gov/products-and-data
- NOAA Space Weather Scales: swpc.noaa.gov/noaa-scales-explanation
- Solar Cycle Progression: swpc.noaa.gov/products/solar-cycle-progression
- SWPC Solar Region Summary: swpc.noaa.gov/products/solar-region-summary
- Sunspot Number (historical, WDC‑SILSO): sidc.be/SILSO