Propagation — how your signal actually gets there
Propagation is the combination of physics (electromagnetics), the atmosphere (ionosphere + troposphere), and geometry. This page focuses on a practical operator model: what mode is likely, what changes it, and what it means for your station.
Today’s quick context (the two knobs you’ll check most)
What does this mean to me?
What does this mean to me?
Ionospheric layers (conceptual)
This is an original diagram (not a copied image) showing the ham-relevant roles of each region.
Which signals refract from which layer?
You’ll often hear "the layer reflects radio". More precisely: the ionosphere refracts HF when the electron density gradient is strong enough. Which region dominates depends on frequency, solar illumination, season, and latitude.
- D region: mostly absorption (especially daylight). This sets your lower usable frequency (LUF).
- E region: can support shorter-hop HF and is the home of Sporadic E (Es), which can open 10m/6m dramatically.
- F region / F2: the main "DX engine" for HF skywave, especially 20m/15m/10m when solar support is strong.
- VHF/UHF: usually line-of-sight; long distance is via tropospheric ducting, meteor scatter, aurora, Es (6m), or satellites.
What conditions affect the layers?
- Solar illumination (day/night): D-region absorption is strongest by day; low bands improve after sunset.
- Solar cycle baseline: higher EUV generally increases F-region density (higher MUF).
- Geomagnetic storms: can deplete/redistribute ionization, increase absorption, and make propagation unstable (especially high latitude).
- Season and latitude: change the ionosphere’s chemistry and sunlight geometry; affects typical MUF/LUF patterns.
- Atmospheric waves: tides and gravity waves modulate density; can help explain rapid swings in conditions.
What does this mean to me?
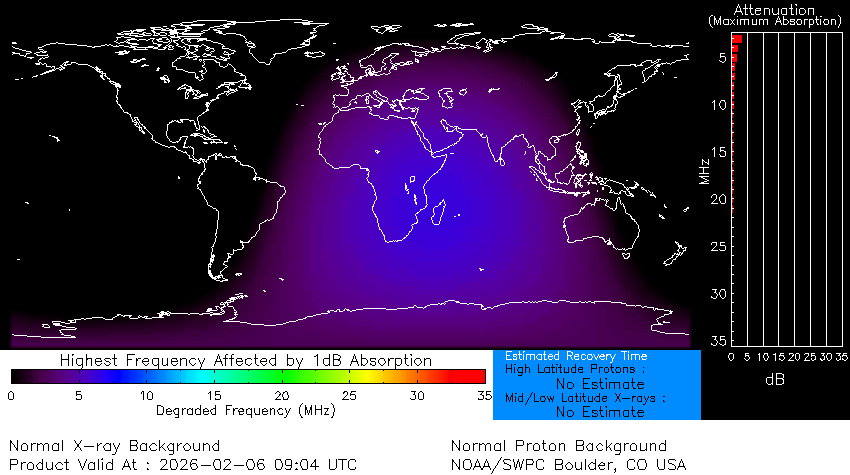
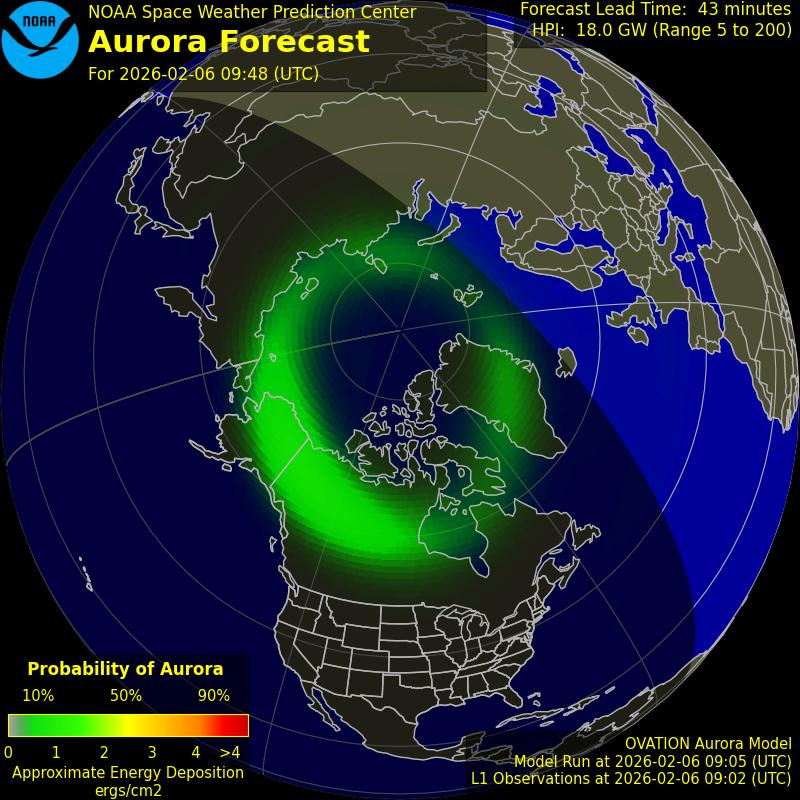
Live absorption + aurora context (SWPC products)
Practical operating playbook (what this means to me)
This is a deliberately simplified “first-order” cheat sheet. Real-world propagation depends on path geometry, season, latitude, and current conditions — but this table helps you pick a band and a plan fast.
| Band | Most Likely Modes | Typical “Engine” | Best Time | Operator Notes |
|---|---|---|---|---|
| 80m | NVIS, regional, occasional DX | F region at high angles; D absorption sets the floor | Night | Best for local/regional nets; quieter after sunset; watch local noise. |
| 40m | Regional + DX | F region | Late afternoon → night | Workhorse band when higher bands are weak; can support long-haul at night. |
| 20m | DX, contesting, reliable day paths | F2 region (main HF refraction) | Day → early evening | First place to check for HF DX. When conditions are “meh,” 20m often still works. |
| 15m | DX, strong daytime openings | F2 region (needs higher MUF) | Midday | Likes higher F10.7 and quiet geomagnetics; great when it’s open. |
| 10m | DX, short skip, sometimes “wide open” | F2 region (high MUF) + sometimes Es | Midday (F2) / seasonal (Es) | When it opens it’s spectacular; when it’s closed it’s silent. Check beacons and FT8 activity. |
| 6m | Sporadic E, meteor scatter, tropo, (rare) F2 | E region (Es) + troposphere | Late spring/summer (Es) | Space weather is secondary most days; learn Es seasonality and watch cluster/beacons. |
| 2m/70cm | Line-of-sight, tropo, aurora, satellites | Troposphere / magnetosphere interactions | Weather-driven / storms | Tropo follows weather patterns; aurora needs geomagnetic disturbance and has a distinctive “buzz.” |
- 80m/40m: strongest at night; great for regional + DX when noise permits.
- 20m: the most reliable DX workhorse; first place to check.
- 15m/10m: best when F10.7 is higher and geomagnetics are quiet; check around local noon.
- When Kp is high: avoid polar routes first; try non-polar headings and lower bands at night.
- 2m/70cm: mostly line-of-sight; look for tropo enhancements (weather-driven).
- 6m: seasonal Sporadic E can create huge openings; space weather is secondary.
- Aurora: during storms, you may get auroral scatter (distinctive distorted audio/tones).
- Satellites: watch for scintillation/fades during disturbed conditions.
FCC + authoritative references (high-level)
I’m not reproducing FCC text verbatim here (copyright/licensing varies by source formatting), but you should treat the FCC rules and official handbooks as the canonical source for definitions and compliance.
- FCC ECFR (47 CFR Part 97): ecfr.gov/.../part-97
- NOAA SWPC (space weather products): swpc.noaa.gov/products-and-data
- ITU-R P.533 (HF prediction reference, technical): itu.int/rec/R-REC-P.533
If you want, I can add a dedicated “Propagation Sources” section mirroring Sources page style.